2. Materials and Methods
The lists of materials, equipment’s and detailed methodologies that were used for the research work are discussed under this chapter.
2.1. Equipments
The equipment’s necessary to conduct the experimental works were disk mill, cutter, flasks, sieves, oven (Memmert 100-800), PH meter (ph-13), balance (FA 2014 China), hot plate, graduate cylinder, Autoclave (RKB496B) Shaker, Muffle furnace (Nabertherm 30-30000C, Germany), distillation setup, airtight desiccator, Viscometer, Hydrometer (Naruekrit R3-XIKQ-AD0G), VIS-UV Spectro photometer (Lambda35/PerkinElmer, Singapore) and FTIR (FT/IR6600, Japan).
Chemicals
All the chemicals used in the experimental work are of analytical grade. These are Sulfuric acid (H2SO4, 98%) for acid hydrolysis and determination of lignin, Potassium hydroxide (85%) for pretreatment, Acetone (99.5%) for extraction, Sodium hydroxide (99.8%, Nor bright, China) for hemicellulose determination,(DNS, potassium sodium tartrate and Sodium hydroxide) to determine the reduced sugar, Yeast extract (agar), urea, dextrose sugar, MgSO4.7H2O and yeast (saccharomyces cerevisiae) to prepare fermentation media, Barium chloride (BaCl2, 99.0-102.0%) for titration and Potassium di chromate (K2Cr2O7, Merck, India) to determine the concentration of bioethanol.
2.2. Sample Collection and Preparation
Banana and papaya peels sample was collected from Bahirdar fruit market. The peels then washed in distilled water until clean and free of dust. After that, it was oven dried for 24 hours at 70°C. The dried peels was ground into a powder using a disk mill and sieved through a 0.5 mm mesh sieve and stored in a sealed polyethylene plastic bag until further use
| [1] | Vijayanand, C., Kamaraj, S., Karthikeyan, S., & Sriramajayam, S. (2016). Research Article characterization of indigenous biomass. 8(50), 2124–2127. |
[1]
.
2.3. Raw Material Characterization and Analysis
2.3.1. Proximate Analysis
A proximate analysis was carried out following the procedure of ASTM E870-82. Proximate analysis was done to determine Physico-chemical properties like percentage volatile matter, percentage ash content, and percentage fixed carbon in sample. It gives the composition of the biomass in terms of gross components such as moisture (M), volatile matter (VM), ash and fixed carbon (FC) contents. Percentage of fixed carbon content was obtained by difference of the sum on percentage volatile matter and ash content. Proximate analysis indicates the percentage of fuel burned in the gaseous and solid states, the quantity of non-combustible ash remaining on the ash pit, or entrained with flue gases.
(i). Moisture Content
The ASTM E-871 standard was used to determine the moisture content of the fruit peel
| [18] | Abdulla, R., Derman, E., Ravintaran, P. T., & Azmah, S. (2017). Fuel Ethanol Production from Papaya Waste using Immobilized Saccharomyces cerevisiae. 2, 112–123. |
[18]
. It influences the physical properties and product quality of nearly all substances and materials at all stages of processing and final product existence. This approach is used to determine the proportion of water in a sample. Three (3) gram banana and papaya peels were weighed in clean oven-dried crucibles of known weight to determine this. The samples and crucible were maintained in a 105°C oven overnight. After reaching room temperature, the crucible with samples was covered and transferred to desiccators, where they were weighed. It was done again and again until a steady weight was achieved. The loss of weight percent expresses the moisture content of fruit peels which is calculated as;
Moisture content (%)100(1)
Where: W1 = original weight, W2 = weight after oven-dried
(ii). Volatile Matter
The volatile matter of a fuel is the condensable (made of heavier molecules, condense upon cooling) and non-condensable (contains lower-molecular-weight gases like carbon dioxide, carbon monoxide, methane, ethane, and ethylene, these do not condense on cooling) vapor released when the fuel is heated. For the determination of volatile matter, the fuel is heated to a standard temperature and at a standard rate 950°C (±20°C) in a controlled environment (in the absence of air by using closed crucible). The volatile matter of peels was determined using muffle furnace (ASTM, E-872). To measure the volatile content, two (2) gram of each of sample was taken in a closed crucible and kept inside the muffle furnace at 700°C for ten minutes. The loss in weight of the sample was calculated and the percent of volatile matter was calculated as,
(2)
(iii). Determination of Ash Content in Biomass
Ash is the inorganic solid residue left after the fuel is completely burned. Its primary ingredients are silica, aluminum, iron, and calcium; small amounts of magnesium, titanium, sodium, and potassium may also be present. The American standard testing method, ASTM D 482 procedure, was used to determine the ash content. Two (2) gram of each sample was taken in crucible and placed in a muffle furnace at 550°C for a period of five hours, then it was cooled to room temperature in a desiccators and its weight was recorded.
The percentage of ash in the sample was determined using the expression
(3)
(iv). Fixed Carbon
The fixed carbon was determined by ASTMD 3172-13 of the sample calculated by subtracting% moisture, ash% and volatile matter% from 100. Due to that, the sample was taken on a dry basis.
| [17] | Amanullah, A., & Kapilan, R. (2021). Utilization of bioethanol generated from papaw peel waste for hand sanitizer production. 8(Iii), 101–124. |
[17]
. The values of fixed carbon (FC)) was indirectly obtained by using the following equations:
FC (%) =(4)
2.3.2. Fruit Peels Composition Analysis
The composition of fruit peels was determined following the experiment reported by the research of Maisyarah, A. et al
| [11] | Guragain, Y. N., De Coninck, J., Husson, F., Durand, A., & Rakshit, S. K. (2011). Comparison of some new pretreatment methods for second generation bioethanol production from wheat straw and water hyacinth. Bioresource Technology, 102(6), 4416–4424. https://doi.org/10.1016/j.biortech.2010.11.125 |
[11]
. The amount of three components of lignocellulosic (cellulose lignin and hemicellulose) in peels was determined by this method.
(i). Determination of Extractives in Biomass Solvent Extraction
For determining the amount of extractive in biomass solvent extraction 300ml of Acetone added to twelve (12) gram of banana and papaya peels (A). Refluxing with the temperature 68.9°C controlled by using a hot plate for two hour. After two hour the sample was dried in an oven.
At 105°C until constant weight was obtained (B). The amount of extractive was identified as:
(A-B) = Amount of extractives (g)(5)
(ii). Determination of Hemicellulose
For determining the amount of hemicellulose in biomass solvent extraction 150ml of Sodium hydroxide (NaOH) solution (0.5mol/l) was added to one (1) gram extractive free banana and papaya peels (A). The temperature 80°C controlled using a hot plate for 3.5 hour. After that the sample was filtered with vacuum filter washed with deionized water until it is free from Na+. The Na+ was detected by using pH and the reading should be closed to 7. The sample was dried in an oven at 105°C until constant weight was obtained (B)
Then (A-B) =Amount of hemicellulose (g)(6)
(iii). Determination of Lignin
To determine the amount of lignin in biomass solvent extraction 30 ml of Sulpheric acid (72%) was added to one gram extractive free peels (B). The sample left at ambient temperature (18°C to 28°C) for 24 hour then boiled at temperature of 100°C controlled by using a hot plate for 1 hour. The mixture was filtered and the solid residue was washed by using deionized water until sulfate ion undetectable. Detection of sulfate ion was done via titration process with 62 ml of 10% barium chloride solution and five drops of methylene blue as color indicator and the color changed from black to grain color. The sample was dried in an oven at 105°C until constant weight obtained (D). The final weight of residue is recorded as lignin content.
(D (sample after dry)-B (original sample)) =amount of lignin (g)(7)
(iv). Determination of Cellulose in Biomass
The cellulose content (% w/w) will be calculated by difference, assuming the extractives, hemicellulose, lignin and cellulose are the only component of the entire biomass
| [3] | Jahid, M., Gupta, A., & Sharma, D. K. (2018). Biotechniques Production of Bioethanol from Fruit Wastes (Banana, Papaya, Pineapple and Mango Peels) Under Milder Conditions. 8(3). https://doi.org/10.4172/2155-9821.1000327 |
[3]
. The cellulose in the biomass was calculated by the value obtained for the corresponding lignin, and hemicellulose.
(8)
2.3.3. Alkali Pretreatment
The substrates at a solid loading of 50% (w/v) was pretreated in autoclave with potassium hydroxide at concentrations of 5% (w/v) as soaking agent for residence time 40 min at 121°C temperature and 15 psi (Pounds per square inch) pressure. After cooling, the contents were filtered with two layers of filter cloth and residues were washed several times in tap water to neutralize the pH followed by a final rinse in distilled water, after that residue was air dried by spreading on paper at 50°C for subsequent analysis
| [15] | Barrera, E., & Cajero, P. (2014). com Characterization of Lignocellulosic Fruit Waste as an Alternative Feedstock for Bioethanol Production. 9(2), 1873–1885. |
[15]
.
2.3.4. Dilute Acid Hydrolysis
Hydrolysis is used to break down the polysaccharides in processed lignocellulosic biomass from papaya and banana peels into monosaccharide subunits. The monosaccharaides formed during hydrolysis will promote
Saccharomyces cerevisiae in its fermentation process. Despite the fact that there are many different types of hydrolysis, dilute acid hydrolysis is a simple and productive process, and acid hydrolysis produces more alcohol than alkaline hydrolysis. Sulfuric acid concentration of 1%, hydrolysis temperature of 98°C, hydrolysis period of 24 hours, and biomass load of 10% were the best conditions for diluted acid hydrolysis
. In these research, done by mixing different amounts of pretreated Banana and Papaya peels between 25 percent to 75 percent with different dilute Sulpheric acid (H
2SO
4) concentrations (0.5 percent to 3 percent v/v) and varying PH value (ranging from 4 to 6) to improve the productivity of fermentable sugars. All the process was carried out in the order of experimental design using design expert software version11, Central Composite design, and quadratic model with 20 runs.
2.3.5. Determination of Reducing Sugar
Total reducing sugar produced from the hydrolysis of fruit peels were estimated prior to the fermentation. Confirming the presence or absence of sugar prior to fermentation saves a considerable amount of time and effort. Estimation of reducing sugar was determined by using the di-nitro-salicylic acid (DNSA) method. DNSA method is depends on DNSA an aromatic compound that reacts with reducing sugars and other reducing molecules to form 3-amino-5-nitrosalicylic acid, which absorbs light strongly at 540 nm (in case of glucose). The filtrate obtained after the hydrolysis step was used for the analysis of reducing sugar. The concentration of reducing sugar in each sample was read from the calibration curve of the standard glucose solution (a known quantity of glucose in a known quantity of water). The reducing sugar content of the hydrolyzed sample was determined by using the di-nitro-salicylic acid (DNSA) method. The filtrate obtained after the hydrolysis step were used for the analysis of sugar by the DNSA method. For this purpose, the standard glucose solution and DNSA reagents will be prepared. The DNSA reagents were prepared by dissolving 1.5gm of DNS in 30ml of 2M sodium hydroxide solution and 45gm of potassium sodium tartrate in 75ml of distilled water and finally mixing the two solutions thoroughly and make the volume to 150 ml by adding distilled water. The glucose standard (stock) was also prepared by adding 250mg of D-Glucose in 100ml distilled water and working standard is take 10 mL from this stock solution and make up the volume to 100 ml. Take 5 clean dry test tubes and pipette out standard sugar solution different concentration of 0.5, 1, 1.5, 2, and 2.5 mL in different test tubes and make up the volume of all test tubes to 3 mL with distilled water. Add 1 mL DNS reagent to all the test tubes and mix plug the test tube with cotton and keep the test tube in a boiling water bath for five minute. Take the tubes and cool to room temperature and read extinction at 540 mm against the blank. Prepare standard curves of the sugars provided and use them to estimate the concentration of the unknowns provided.
2.3.6. Preparation of Inoculum
In Yeast Extract Peptone and Dextrose (YEPD) broth, the cells of Saccharomyces cereviacae were aseptically cultivated after being purchased from the market. Dissolve ten gram of dextrose, five gram of yeast extract and five gram of peptone in 500ml of distilled water. After the media had been carefully wrapped with aluminum foil and sterilized at 121°C for 15 minutes, two point five gram of the yeast Saccharomyces cerevisiae was added. The conical flask was then placed in an incubator that shaken for 24 hours at 30°C and 120rpm.
2.3.7. Fermentation
The prepared yeast
Saccharomyces cerevisiae was introduced to the sample after it had undergone a full hydrolysis process in order to start the fermentation process. After 72 hours of fermentation at 30°C, pH 5.0-5.5, and 2 g/L yeast load, papaya peel waste was converted into ethanol with the highest purity possible
. In my studies, a hydrolyte sample was prepared using various fermentation times (24, 48, 72, and 96 hours), PH 4-6, and a five percent inoculum size, and the samples were then put in a shaker incubator at 120 rpm. Separate hydrolysis and fermentation (SHF) were conducted at different incubation periods (24, 48, 72, and 96 hours) to maximize the bioethanol yield.
2.3.8. Distillation
After the fermentation process was optimized, the resulting product was distilled for 4-6 hours to separate the bioethanol produced from the other component and to improve the ethanol's purity. The heating mantle's temperature was adjusted from 78°C to 60°C
| [2] | Tsegu, G., Birri, D. J., Tigu, F., & Tesfaye, A. (2022). Bioethanol production from biodegradable wastes using native yeast isolates from Ethiopian traditional alcoholic beverages. Biocatalysis and Agricultural Biotechnology, 43, 102401. https://doi.org/10.1016/j.bcab.2022.102401 |
[2]
.
Table 1.
Independent variables affecting Reducing sugar/ ethanol yield. Independent variables affecting Reducing sugar/ ethanol yield. Independent variables affecting Reducing sugar/ ethanol yield. Factors | Units | Low (-) | High (+) | Goals |
Mixing ratio | % | 25 | 75 | Minimize |
Concentration of acid | % | 0.5 | 3 | Minimize |
PH | - | 4 | 6 | In range |
2.4. Determination of the Properties of Ethanol
2.4.1. Determination of Concentration of Bioethanol
The concentration of ethanol produced at different fermentation times, such as 24, 48, 72, and 96 hours, should be known in order to determine the best fermentation time for bioethanol production. This can be done by mixing ten (10) grams of banana and papaya peels in 100 milliliters and using a potassium dichromate test to determine the results. The best fermentation time is then checked using a UV spectrophotometer at 580 nm against a blank. The concentration of bioethanol was determined from the equation
Where A=Absorbance, ℇ=Absorptivity of particular chemical=1.5M-1cm-1
b=optical path length=1cm
Volume of fermentation medium=500ml, Volume of purified bioethanol=200ml
%Concentration
2.4.2. Determination of Yield of Bioethanol
After determining the ideal fermentation period, I scaled up the biomass (50:50) by combining 25 grams of banana peels and 25 grams of papaya peels hydrolysis in 500 milliliters of 1.75 percent H2SO4 for 24 hours. I then fermented using the same procedure, and the purification was increased using double distillation. Based on bioethanol produced during fermentation and from the original sample, the yield of bioethanol produced in these studies was calculated.
Yield of bioethanol produced from the fermentation is calculated as:
%yield(10)
Yield of bioethanol produced from the original sample is calculated as:
%yield=(11)
2.4.3. Density and Specific Gravity Test
After distillation, the specific gravity of fermented sample was determined using a hydrometer. Fill the cylinder with an ethanol sample first, then carefully put the hydrometer into the sample by holding it at the top of the stem. Release the hydrometer after it is roughly at its equilibrium position, and then record the reading.
Specific gravity=density of substance/ referencedensity(12)
2.4.4. Viscosity Test
At room temperature, the viscosity of the product was measured using a rotational viscometer (Viscostar plus L, Switzerland) with different spindles at a shear rate of 100 rpm. The sample was placed in the sample holder, and the selected spindle was lowered perpendicularly into the sample, being careful not to let the spindle hit the container's bottom. The spindle was connected to the viscometer and allowed to rotate at room temperature at a set speed
.
2.4.5. Fourier Transform Infrared Spectroscopy (FTlR) Determination of Bioethanol
The major functional groups present in the produced bio-ethanol were determined by using fourier transform infrared spectroscopy (FTIR-6600, Japan) with the help of IR correlation charts. The IR spectrum was reported by% transmittance. The wavenumber region for the analysis was 4000-400cm
-1 (in the mid-infrared range). The OH stretch of alcohol found between 3500 - 3200 cm
-1, while the region 2924-2920 cm
-1 confirms the C-H stretch of alcohols and the region 1260 -1050 cm
-1 confirms the C-O stretch of alcohols and the C-C bond stretched around 1100 cm
-1 | [4] | Singh, A., & Bishnoi, N. R. (2013). Comparative study of various pretreatment techniques for ethanol production from water hyacinth. Industrial Crops and Products, 44, 283–289. https://doi.org/10.1016/j.indcrop.2012.11.026 |
[4]
.
3. Results and Discussions
3.1. Proximate Analysis of Banana and Papaya Peels
The content of moisture, volatile matter, ash, and fixed carbon in the peels of the banana and papaya are determined by using ASTM standardized methods. The outcomes of each experiment were provided as means standard deviation, and each experiment was carried out in triplicate on a dry basis (Wt. percent). The proximate composition of banana and papaya peels was determined following equations
1-4, and the result is shown in
Table 2.
The findings of this study are generally consistent with those found by the researchers described previously. The dried samples had moisture content levels between 6.7 and 11.6 percent, which is suitable for biomass because higher moisture content biomass requires more heat to evaporate, which has a negative impact on fuel energy values (HHV). According to biomasses with greater ash levels above 20%, they are not good energy converters. The ash contents were around 9 percent, which was ideal. Therefore, the optimum biomass feedstock for bioenergy conversion has minimal ash and high volatile matter concentration
| [10] | Hu, J., Arantes, V., & Saddler, J. N. (2011). The enhancement of enzymatic hydrolysis of lignocellulosic substrates by the addition of accessory enzymes such as xylanase: Is it an additive or synergistic effect? Biotechnology for Biofuels, 4(October). https://doi.org/10.1186/1754-6834-4-36 |
[10]
. High fixed carbon contents are strong markers of the banana and papaya peels biomass suitability for bioenergy conversion, and the fixed carbon in this study exhibits greater values in comparison to the finding provided by
| [13] | Debebe, D., Gabriel, T., Brhane, Y., Temesgen, A., Nigatu, M., & Marew, T. (2018). Comparative in Vitro Evaluation of Brands of Clotrimazole Cream Formulations Marketed in Ethiopia. Journal of Drug Delivery and Therapeutics, 8(1), 17–22. https://doi.org/10.22270/jddt.v8i1.1546 |
[13]
. This is the desirable attribute of the biomass.
Table 2.
Results of proximate composition of banana and papaya peels. Results of proximate composition of banana and papaya peels. Results of proximate composition of banana and papaya peels. Samples | Components (wt% dry matter) |
Moisture content | Volatile matter | Ash content | Fixed carbon | References |
Banana peels | 6.67±0.33 | 82.75±0.25 | 5.75±0.25 | 5 | This study |
6.70 | 85.26 | 5.01 | 2.7±0.78 | | [10] | Hu, J., Arantes, V., & Saddler, J. N. (2011). The enhancement of enzymatic hydrolysis of lignocellulosic substrates by the addition of accessory enzymes such as xylanase: Is it an additive or synergistic effect? Biotechnology for Biofuels, 4(October). https://doi.org/10.1186/1754-6834-4-36 |
[10] |
Papaya peels | 8.165±0.165 | 81.25±0.75 | 5.5±0. 5 | 6 | This study |
8.04±0.06 | ** | 5.8±0.01 | ** | | [13] | Debebe, D., Gabriel, T., Brhane, Y., Temesgen, A., Nigatu, M., & Marew, T. (2018). Comparative in Vitro Evaluation of Brands of Clotrimazole Cream Formulations Marketed in Ethiopia. Journal of Drug Delivery and Therapeutics, 8(1), 17–22. https://doi.org/10.22270/jddt.v8i1.1546 |
[13] |
3.2. Compositional Analysis of Banana and Papaya Peels
Following the experiment described by ASTM standardized methods. This technique was used to calculate the amounts of the three lignocellulosic components (cellulose, lignin, and hemicellulose) in peels. The findings of every experiment were provided as means standard deviation and were conducted on a dry basis (percent w/w) in triplicate. The compositional analysis of banana and papaya peels was determined following equations
1-4, and the result was shown in (
Table 3).
Table 3. The chemical composition of banana and papaya peels.
Sample | Extractives (gram) | Hemicellulose (%) | lignin (%) | Cellulose (%) | References |
Banana peels | 1.1 | 38.1 | 15.7 | 45.1 | This study |
** | 9.4 | 4.5 | 34.8 | | [16] | Ayeni, A. O., Adeeyo, O. A., Oresegun, O. M., & Oladimeji, T. E. (2015). Compositional analysis of lignocellulosic materials: Evaluation of an economically viable method suitable for woody and non-woody biomass. American Journal of Engineering Research, 44, 2320–2847. |
[16] |
Papaya peels | 2.08 | 42 | 8.6 | 47.32 | This study |
** | 24.8 | 2.7 | 20.4 | | [16] | Ayeni, A. O., Adeeyo, O. A., Oresegun, O. M., & Oladimeji, T. E. (2015). Compositional analysis of lignocellulosic materials: Evaluation of an economically viable method suitable for woody and non-woody biomass. American Journal of Engineering Research, 44, 2320–2847. |
[16] |
The findings show that both fruit peels had lower lignin content (15.7BP, 8.6PP Wt. percent), higher cellulose content (45.1BP, 47.32PP Wt. percent), and hemicellulose (38.1BP, 42PP Wt. percent). Despite a few differences in the amounts of cellulose (34.8 BP, 20.4 PP Wt. percent), hemicellulose (9.4 BP, 24.8 PP Wt. percent), and lignin (4.5 BP, 2.7 PP Wt. percent), the results of this study are generally consistent with those of the aforementioned researchers
| [16] | Ayeni, A. O., Adeeyo, O. A., Oresegun, O. M., & Oladimeji, T. E. (2015). Compositional analysis of lignocellulosic materials: Evaluation of an economically viable method suitable for woody and non-woody biomass. American Journal of Engineering Research, 44, 2320–2847. |
[16]
. This is because both biotic and abiotic factors, including as species differences, development stages, harvesting times, and pretreatments, have an impact on the carbohydrate And lignin content of banana and papaya peels.
3.3. Determination of Reducing Sugar by DNSA Method
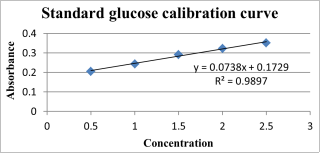
Figure 1. Plot of standard curve (absorbance versus concentration (g/ml)).
The amounts of glucose after hydrolysis were measured by using UV-spectrophotometer. This device measured the absorbance of each sample at a wavelength of 540 nm and this absorbance value was converted into concentration using the standard curve. The standard curve is plotted as shown in (
Figure 1).
The concentrations of the unknown sample were determined from the equation
y = 0.0738x + 0.1729, X=y-0.1729/0.0738*DF(13)
DF means Dilution factor is= 20*10
-1. The value of R-squared from the standard cure plot of
Figure 1 is 0.98 which indicates that the equation is the best fit with the standards.
3.4. Analysis of Experimental Results
To determine the percentage of reducing sugar in each run in different mixing ratio, hydrolysis acid concentration and PH done by design expert software for optimization of hydrolysis factors.
The concentrations of the unknown sample were determined from the equation:
Concentration= (0.606) − (0.1729)/0.0738*2 =11.737 g/ml. The greatest amount of reducing sugar produced during this investigation was 11.737g/ml, as shown in the
Table 4, at run 3 with a mixing ratio of 50:50 bananas to papaya peels, at a concentration of 1.75 percent Sulpheric acid, and in a hydrolysis period of 24 hours. The standard cure plot of R-squared value is 0.98, which shows that the equation offers the best fit to the standards. Following knowing of the highest-recorded run for reducing sugar, run 3, fermentation and distillation follow.
Table 4. Experimental design for optimization of hydrolysis.
Std | Run | Factor 1 | Factor 2 | Factor 3 | Response 1 |
A: Mixing ratio (%) | B: Hydrolysis acid conc (%) | C:PH | Reducing sugar (g/ml) |
13 | 1 | 50 | 1.75 | 4 | 10.26 |
9 | 2 | 25 | 1.75 | 5 | 9.25 |
18 | 3 | 50 | 1.75 | 5 | 11.737 |
14 | 4 | 50 | 1.75 | 6 | 10.22 |
15 | 5 | 50 | 1.75 | 5 | 9.78 |
7 | 6 | 25 | 3 | 6 | 6.19 |
4 | 7 | 75 | 3 | 4 | 7.02 |
10 | 8 | 75 | 1.75 | 5 | 9.33 |
16 | 9 | 50 | 1.75 | 5 | 10.83 |
19 | 10 | 50 | 1.75 | 5 | 10.92 |
3 | 11 | 25 | 3 | 4 | 7.79 |
8 | 12 | 75 | 3 | 6 | 8.38 |
2 | 13 | 75 | 0.5 | 4 | 1.55 |
17 | 14 | 50 | 1.75 | 5 | 10.72 |
12 | 15 | 50 | 3 | 5 | 8.97 |
11 | 16 | 50 | 0.5 | 5 | 4.42 |
20 | 17 | 50 | 1.75 | 5 | 10.89 |
5 | 18 | 25 | 0.5 | 6 | 0.598 |
6 | 19 | 75 | 0.5 | 6 | 2.87 |
1 | 20 | 25 | 0.5 | 4 | 3.056 |
3.4.1. Analysis of Variance (ANOVA)
The hydrolysis conditions were optimized using a central composite design with three parameters (Mixing ratio, acid concentration, and pH) at various fermentation periods and one response, which was Reducing sugar (percent). The correlation coefficients of the model as a function of the response were discovered using statistical analysis.
3.4.2. ANOVA for Response Surface Quadratic Model
ANOVA analysis is used to examine whether or not the quadratic model is significantly impacted by the design parameters. The relevance of each coefficient was assessed using the probability values (P-values), which also highlighted the strength of each parameter's interaction. The significance of the corresponding coefficient increases as the p-values decrease.
3.4.3. Development of Regression Model Equation
A model equation is a mathematical expression in which the whole model was expressed in a single equation that helps to maximize response. The model equation that correlates the response (reducing sugar) to the process variables in terms of actual value after excluding the insignificant terms was given below. The predicted model for the reducing sugar in terms of the coded factors is given in (equation
14).
Final Equation in Terms of Coded Factors
Reducing sugar =+10.80+0.2266A+2.59B-0.1418C+0.0817AB+0.8423AC+0.1122BC-1.49A2-4.09 B2-0.5429 C2(14)
The mathematical model equation of yields was developed by using coded variables of each factor. The coefficients of each coded variable were obtained. This result also helps to predict which factor was affecting the ethanol yield positively and negatively. Positive coefficients affect the yield of ethanol positively and whereas negative coefficients affect the yield of ethanol negatively. The yield was as response and affected by linear terms such as mixing ratio (A), Hydrolysis acid concentration (B) and PH (C), and pure quadratics terms (A2, B2, and C2) and interaction quadratic terms (AB, AC, and BC).
The coded factors A, B, AB, AC and BC have positively affected the yield whereas C, A2, B2 and C2 had negatively affected the yield. The intercepts for this equation were 10.80 which help to predict the precise results of reducing sugar. Based on this, when the effect of factors A, B, AB, BC and AC increases, the yield was increased proportionally within the specified range. In the same way, when the effect of factors C, A2, B2 and C2 increases, the yield of reducing sugar was decreased. The coded variable was used for model equation development of bioethanol because it is simple to represent the equation and simple to understand.
Final Equation in Terms of Actual Factors
Reducingsugar=10.68130+0.074894A+10.64549B+3.44519C+0.002616AB+0.033690AC+0.089800BC-0.002389A2-2.61623B2-0.542864C2
A=Mixing ratio B= Hydrolysis acid concentration C= PH
3.5. Interaction Effects of Experimental Variables on Bioethanol Yield
In this study mixing ratio of banana and papaya peels, pH and acid concentrations are the main parameters optimized in hydrolysis process that affect Production of reducing sugar or bioethanol. The best way of showing the effects of this parameter on yield is to generate response surface plots. The three-dimensional response surfaces effect was plotted in
Figures 2-4 as a function of the interactions of any two of the variables by holding the other value of the variable at the center point.
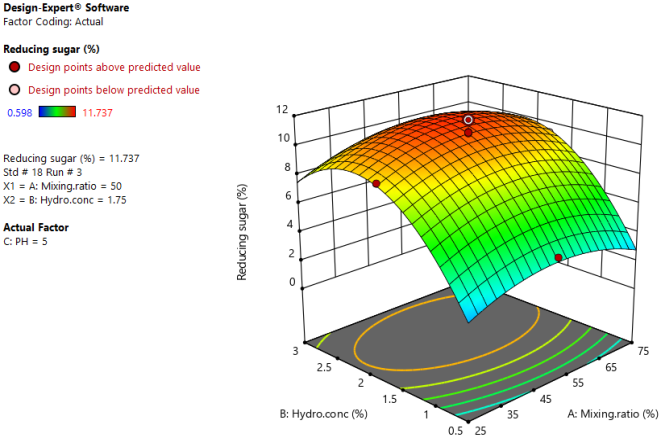
3.5.1. Interaction Effect of Mixing Ratio and Acid Concentration
Figure 2. Response surface plot of the interaction effects of mixing ratio and acid concentration on the yield of reducing sugar.
Figure 2 clearly shows that the yield increases with increasing both in interaction of mixing ratio and acid concentration up to the center point, while further increasing these parameters results in a reduction of yield. This is because increasing acid concentrations tends to formation of undesirable by-products along with sugar such as furfural and 5-dihydroxymethyl furfural, which are toxic known to inhibit fermentation and as the solid loading increased beyond the maximum, sugar release decreases due to increase in viscosity which might lead to restrict the hydrolysis.
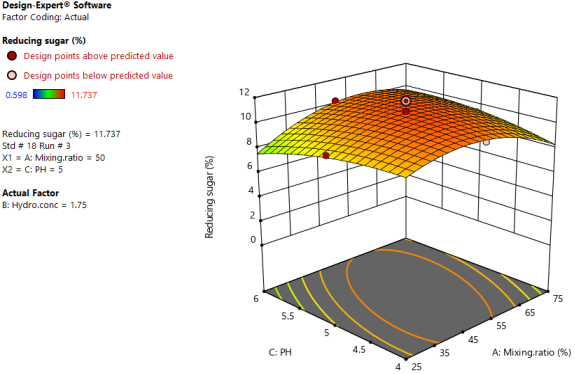
3.5.2. Interaction Effect of Mixing Ratio and pH
The yield reducing sugar was increases with increasing of both the interaction of mixing ratio and PH as shown in the
Figure 3, while further increasing these parameters results in a reduction of yield. This is because Yeast needs a slightly acid environment in order to grow well, with increase in pH to basic conditions yeast produces acid rather than alcohol and this lead to the decrease in alcohol production as the pH increase.
Figure 3. Response surface plot of the interaction effects of mixing ratio and PH on the yield.
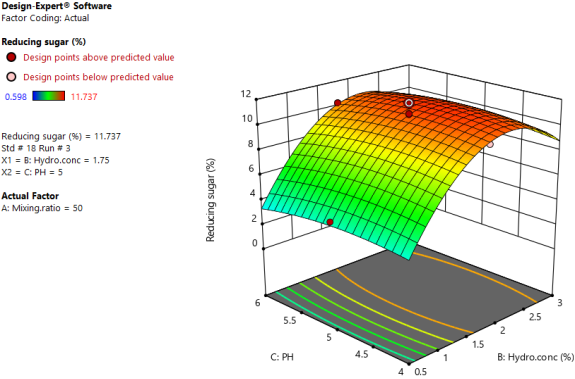
3.5.3. Interaction Effect of Acid Concentration and pH
Figure 4 shows when increasing of acid concentration from 0.5 to 1.75% and PH from 4 to 5 the yield also increases, reversely further increasing of both parameters beyond optimum negatively affect the reducing sugar. Due to higher concentration of H
2SO
4 results in the formation of furfural and hydroxyl methyl furfural that are inhibitors of fermentation of sugars.
Figure 4. Response surface plot of the interaction effects of mixing ratio and acid concentration on the yield of reducing sugar.
3.6. Optimization of Hydrolysis Parameters Using Response Surface Methodology
A collection of statistical and mathematical methods called response surface methodology (RSM) can be used to create, enhance, and optimize processes. Additionally, it plays a significant role in the development, creation, and formulation of new products as well as the enhancement of current product designs. The optimization of hydrolysis conditions for reducing sugar production from mixing of BP and PP was summarized in
Table 5.Table 5. Constraints for optimization of yield.
Name | Goal | Lower Limit | Upper Limit |
A: Mixing. ratio | minimize | 25 | 75 |
B: Hydro. conc | is in range | 0.5 | 3 |
C: PH | is in range | 4 | 6 |
Reducing sugar | Maximize | 0.598 | 11.737 |
Table 6. Optimized solution of reducing sugar from banana peel and papaya peel.
No | Mixing. Ratio | Hydrolysis acid concentration | PH | Reducing sugar | Desirability |
1 | 50.000 | 1.75 | 5.000 | 10.801 | 1.000 selected |
3.7. Model Validation
An experiment was carried out using the optimum condition that was acquired from the central composite design (i.e. In
Table 6 10.801 percent of the yield was achieved. Therefore, it is possible to conclude that this is fairly consistent with the outcome that was predicted. Because of this, we believed that the model can accurately and consistently estimate the ethanol yield.
3.8. Characterization of the Produced Ethanol
3.8.1. Determination of Concentration of Ethanol
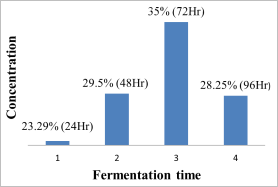
After distillation the concentration of bioethanol in different fermentation time i.e. 24, 48, 72 and 96 hours was determined by potassium di chromate test in order to screen the best fermentation time with UV spectrophotometer at 580 nm against the blank was recorded.
The high bioethanol percentage was found at 72 hours of fermentation. I scaled up the biomass (50:50) and combined 25 grams of BP and 25 grams of PP hydrolysis in 500 milliliters of 1.75 percent H
2SO
4 for 24 hours before fermenting in the same manner as before but with greater purification. Read the absorbance following double distillations at 580 nm against a blank and the result was 0.908. The concentration of bioethanol was calculated based on equation (
9), which came out 17.62 percent w/v.
Figure 5. The concentration of ethanol in different fermentation time.
3.8.2. Determination of Yield of Bioethanol
The yield of bioethanol produced in these work was done based on bioethanol produced from the fermentation and produced from the original sample by using equation
10 and
11. The yield of bioethanol produced from mixing of 50:50%ratio of banana and papaya peels from fermentation and from original sample were 40% w/v and 55.68% respectively. The results obtained from mixtures of banana and papaya peels 55.68%w/w was higher than results recorded in single banana and papaya peels, since maximum yield of ethanol 13.84% obtained from banana peels and 8.0% from papaya peels
| [14] | Danmaliki, G. I., Muhammad, A. M., Shamsuddeen, A. A., & Usman, B. J. (2016). Bioethanol Production from Banana Peels Bioethanol Production from Banana Peels. June. https://doi.org/10.9790/2402-1006025662 |
| [17] | Amanullah, A., & Kapilan, R. (2021). Utilization of bioethanol generated from papaw peel waste for hand sanitizer production. 8(Iii), 101–124. |
[14, 17]
.
3.8.3. Viscosity of the Produced Bio Ethanol
The viscosities of the bioethanol produced were determined by using a rotational viscometer (Viscostar plus L, Switzerland). The obtained result was 1.3m2/s. There was some deviation of the experimental value from the standard value of (1.2m2/s). This may be due to experimental or personal errors. Fuels tend to flow with much ease when their viscosity is excessively low such situations usually have an adverse effect as the lubricating film between moving and stationary parts in the carburetor or pump are not maintained. On the other hand, very high fuel viscosity hinders the atomization of the fuel into small droplets to facilitate good vaporization and combustion.
3.8.4. Density and Specific Gravity Test
The specific gravity of the produced bioethanol from mixture of banana and papaya peel was determined by using a hydrometer. The result obtained shows a specific gravity of 0.940. The density of bioethanol was also determined from its relationship with specific gravity by using (Equation
9).
The density of pure ethanol was 0.787 g/cm. Hence, bioethanol produced from mixing of banana and papaya peels 0.95𝑔/𝑚3 was denser than pure ethanol. The difference was resulted due to the existence of water as a mixture of produced ethanol.
3.8.5. FTIR Characterization of Bioethanol
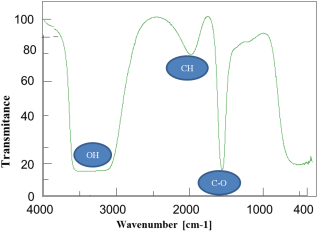
Figure 6. FTIR Spectrum analysis of ethanol from mixed banana and papaya peels.
The functional group of bioethanol was analyzed using Fourier-transform infrared spectroscopy (FTIR). The vibration of each bond stretch was obtained by using the absorbance and transmittance analyzed by the FTIR machine. The X-axis was wavenumber and Y-axis was the percent of transmittance. The distillates were characterized by the infrared spectrum to understand some specific peaks for bioethanol structure.
When the liquid film runs between 4000 to 400cm
-1 with varying broad bands indicates the OH stretch of alcohol found between 3500 - 3200 cm
-1, while the region 2924-2920 cm
-1 confirms the C-H stretch of alcohols and the region 1260 - 1050 cm
-1 confirms the C-O stretch of alcohols and the C-C bond stretched around 1100 cm
-1 | [4] | Singh, A., & Bishnoi, N. R. (2013). Comparative study of various pretreatment techniques for ethanol production from water hyacinth. Industrial Crops and Products, 44, 283–289. https://doi.org/10.1016/j.indcrop.2012.11.026 |
[4]
. This shows that the product obtained from mixture of banana and papaya peels is bioethanol due to the presence of these peaks.